
Caia
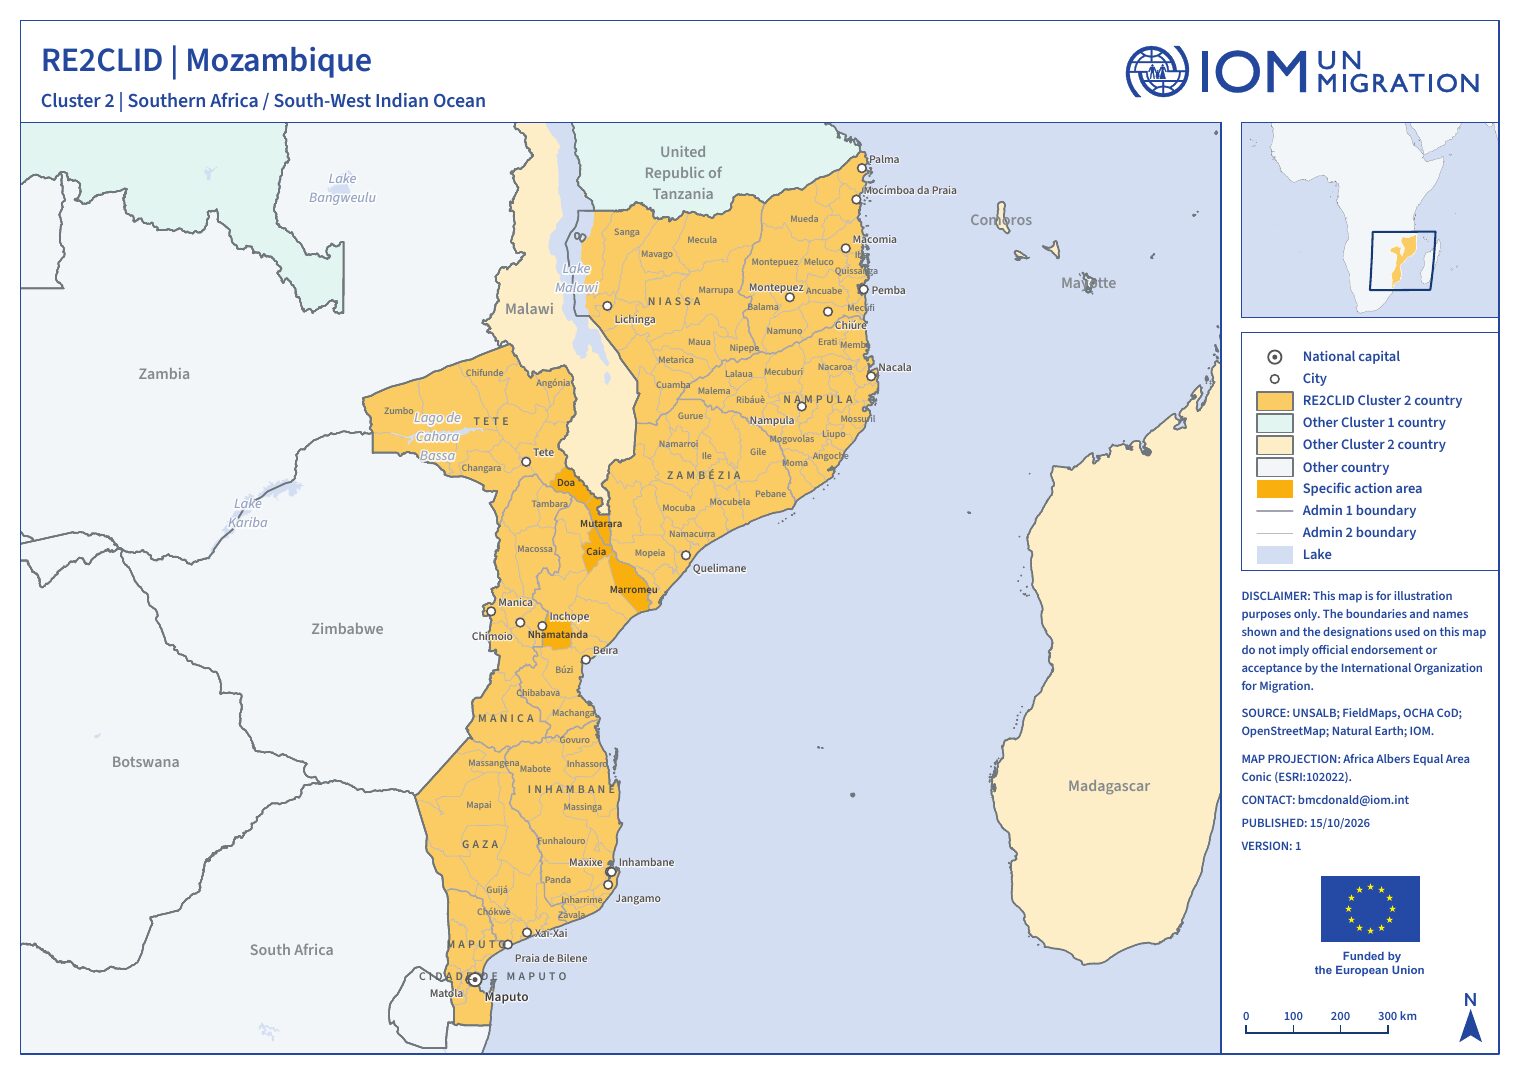
District action area (admin-2) of the RE2CLID programme in Mozambique, Cluster 2: Southern Africa & South-West Indian Ocean.
Profile at a glance
- Country
- Mozambique
- Admin-1
- Sofala (MZ07)
- Admin-2
- Caia (MZ0703)
- Seasonal hazards & outbreaks
- Cyclone season, Rainy season
- Boundary source
- RE2CLID action-area GeoPackage
Where activities are targeted
The whole district is the action area. Sub-district units have not been specified yet and will be agreed during the inception phase.
Caia on the map
- Action area (admin-1)
- This district
- Admin-3 action unit
- Admin-4 / colline
Seasonal calendar
Calendar for the Sofala action area (MZ07), which covers Caia. Recurring patterns, not forecasts.
Today. Events are recurring seasonal patterns, not forecasts.
Calendar narrative & sources
This calendar combines 0 country-wide events with 8 recorded specifically for Sofala, which ACAPS geocodes to GADM admin-1 units that cover this action area.
The recorded seasonal hazards are the rainy season in Gaza, Inhambane, Manica, Maputo, Maputo City, Sofala, Tete (Oct–Mar) and the cyclone season in Gaza, Inhambane, Manica, Maputo, Maputo City, Sofala, Tete (Oct–Mar). Planting and growing periods: Main planting in Gaza, Inhambane, Manica, Maputo, Maputo City, Sofala, Tete (Oct–Dec), 2nd planting in Gaza, Inhambane, Manica, Maputo, Maputo City, Sofala, Tete (May–Jul) and Land preparation in Gaza, Inhambane, Manica, Maputo, Maputo City, Sofala, Tete (Aug–Sep). Harvests: the main harvest in Gaza, Inhambane, Manica, Maputo, Maputo City, Sofala, Tete (Mar–May) and the 2nd harvest in Gaza, Inhambane, Manica, Maputo, Maputo City, Sofala, Tete (Jul–Aug). The lean season runs from October to January in Gaza, Inhambane, Manica, Maputo, Maputo City, Sofala, Tete.
The 8 records come from 1 source dated 2013. Entries more than 10 years old should be checked against current FEWS NET, FAO GIEWS or national meteorological calendars before use in planning.
- FEWS NET (2013-12-14), via ACAPS Seasonal Events Calendar. fews.net/southern-africa/mozambique/seasonal-calendar/decemb
Caia district analysis
The district profile is the most local layer of the CVA. It brings together hazard exposure, livelihood dependencies, access to basic services and displacement history for the action units, and where possible repeats the assessment across the rainy and dry seasons.
Questions the district analysis will answer
- Which action units face the highest combined hazard exposure and vulnerability?
- Which livelihoods and services are most sensitive to the seasonal calendar?
- Which local capacities and plans can be strengthened to prevent or reduce displacement?
Analytical dimensions
- 1Hazard
Sudden-onset (floods, cyclones, landslides) and slow-onset (lake-level rise, drought, degradation) - 2Exposure
People, settlements, infrastructure and livelihoods in hazard-prone areas - 3Vulnerability
Socio-economic sensitivity, disaggregated by sex, age and disability - 4Adaptive capacity
Services, institutions, social protection and coping strategies - 5Displacement risk
Combined likelihood and scale of disaster displacement
Outputs for Caia
- Analysis report · Quarto web pagePending
- Summary brief · PDFPending
- Briefing slides · Quarto Reveal.js slidesPending